Search Posts
Recent Posts
- Rhode Island Weather for June 4, 2025 – Jack Donnelly June 4, 2025
- Sour Grapes time! – Tim Jones (meet Tim at AnimeCon) June 4, 2025
- Lawsuit filed to stop Empire Wind Project by 4 environmental groups and fishermen June 4, 2025
- It is what it is: 6.4.25 – Jen Brien June 4, 2025
- New ALS treatment by PathMaker Neurosystems. Co. funded by RI Life Sciences Hub to come to RI. June 3, 2025
Categories
Subscribe!
Thanks for subscribing! Please check your email for further instructions.

Study: Rhode Island 10th most moved-to state – and it’s pandemic related
United Van Lines 45th annual National Movers Study shows the top 10 states moved in to and moved out of – and Rhode Island made the list. Counter-intuitively, it was for INBOUND movers, and it was the 2nd year out of 45 years for this positive finding.
In 2021 – and 2020, the moving company study showed more people moved into Rhode Island than moved out of Rhode Island. These two years are unique in the 45 years the study has been conducted.
At a time when assumptions are that people are leaving Rhode Island for better – and sunnier – and economically friendlier – states, the reasons seem to be loosely identified as pandemic-related, where people want to move out of big cities to lower-density areas – and people want to move to be closer to their families throughout the year.
Prior to 2020, the number leaving and coming to Rhode Island was basically a tie, except for years 1995 and 1996 which had the highest percent outbound from the state.

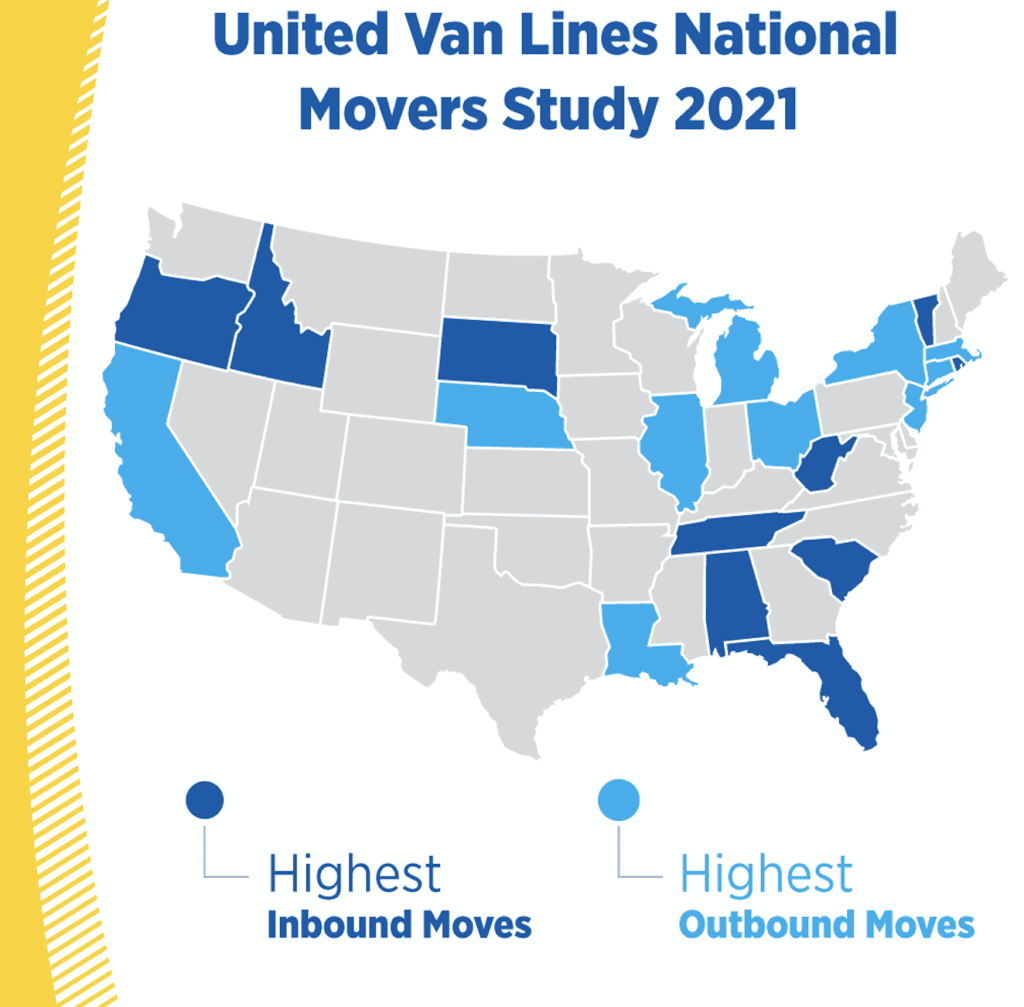
The annual study, which tracks the company’s exclusive data for customers’ state-to-state migration patterns, determined Vermont as the state with the highest percentage of inbound migration (74%) with United Van Lines. Topping the list of outbound locations was New Jersey (71%), which has held the spot for the past four years.
South Dakota (69%), South Carolina (63%), West Virginia (63%) and Florida (62%) were also revealed as the top inbound states for 2021. Meanwhile, states like Illinois (67%), New York (63%), Connecticut (60%) and California (59%), which have regularly appeared on the top outbound list in recent years, again ranked among states with the largest exoduses.
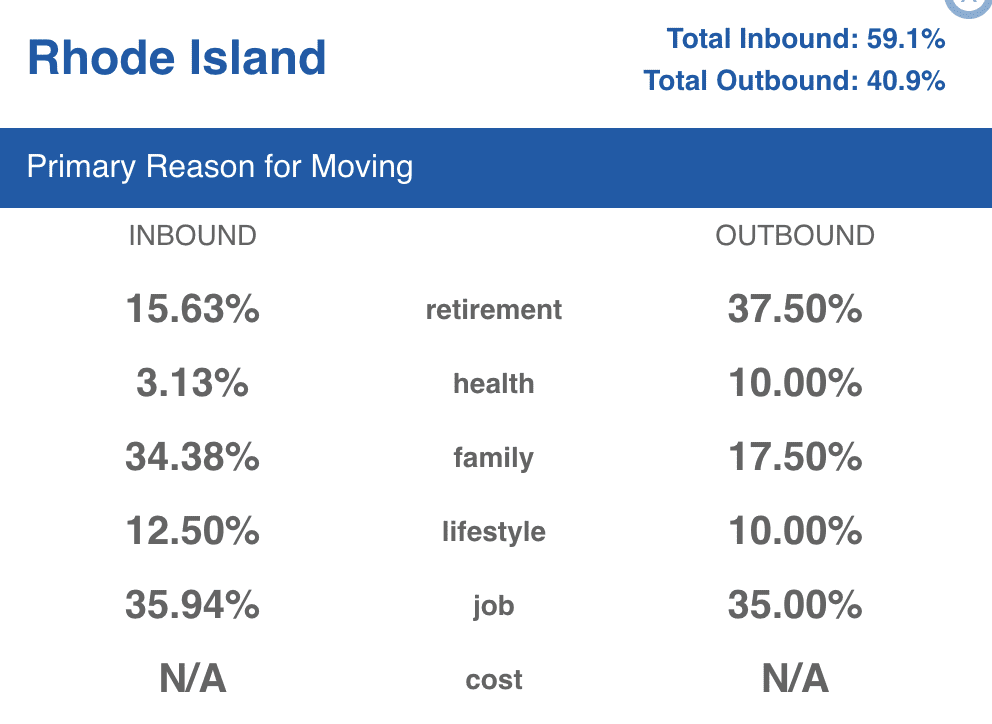
In addition to the state-by-state data, each year United Van Lines also conducts an accompanying survey to examine the motivations and influences for Americans’ interstate moves. This year’s survey results indicated 31.8% of Americans who moved did so in order to be closer to family – a new trend coming out of the pandemic as priorities and lifestyle choices shift. Additionally, 32.5% of Americans moved for a new job or job transfer, a significant decrease from 2015, when more than 60% of Americans cited a job or transfer.
“This new data from United Van Lines is indicative of COVID-19’s impact on domestic migration patterns, with 2021 bringing an acceleration of moves to smaller, midsized towns and cities,” Michael A. Stoll, economist and professor in the Department of Public Policy at the University of California, Los Angeles, said. “We’re seeing this not only occur because of Americans’ desire to leave high density areas due to risk of infection, but also due to the transformation of how we’re able to work, with more flexibility to work remote.”
What’s more, amid the pandemic, many Gen Xers are retiring (often at a younger age than past generations), joining the Baby Boomer generation. While many are retiring to states like Florida, United Van Lines’ data reveals they’re not necessarily heading to heavily populated cities like Orlando and Miami — they’re venturing to less dense places like Punta Gorda (81% inbound), Sarasota (79% inbound) and Fort Myers-Cape Coral (77% inbound). Similarly, in Oregon, cities including Medford-Ashland (83%) and Eugene-Springfield (79%) saw high inbound migration in 2021.
“For 45 years now, our annual United Van Lines study, with its data-driven insights, has allowed us to explore a deeper understanding of Americans’ overall migration patterns,” Eily Cummings, director of corporate communications at United Van Lines, said. “As the pandemic continues to impact our day-to-day, we’re seeing that lifestyle changes — including the increased ability to work from home — and wanting to be closer to family are key factors in why Americans are moving today.”
Moving In
The top inbound states of 2021 were:
1. Vermont
2. South Dakota
3. South Carolina
4. West Virginia
5. Florida
6. Alabama
7. Tennessee
8. Oregon
9. Idaho
10. Rhode Island
Of the top ten inbound states, six — Vermont, South Dakota, West Virginia, Alabama, Oregon and Idaho — are among the 20 least densely populated states in America, with less than 100 people per square mile. And, Tennessee and South Carolina are among the top 25.
Moving Out
The top outbound states for 2021 were:
1. New Jersey
2. Illinois
3. New York
4. Connecticut
5. California
6. Michigan
7. Massachusetts
8. Louisiana
9. Ohio
10. Nebraska
Nine of the top 10 outbound states are considered densely populated, further illustrating America’s shift to less crowded states.
Several states saw nearly the same number of residents moving inbound as outbound. Kentucky and Wyoming are among these “balanced states.”
Since 1977, United Van Lines annually tracks migration patterns on a state-by-state basis. The 2021 study is based on household moves handled by United within the 48 contiguous states and Washington, D.C. and ranks states based off the inbound and outbound percentages of total moves in each state. United classifies states as “high inbound” if 55 percent or more of the moves are going into a state, “high outbound” if 55 percent or more moves were coming out of a state or “balanced” if the difference between inbound and outbound is negligible.
Of course the results reflect people who hired a professional moving company to move, but the data will be interesting to watch in overall census trends in the next few years. The many years of a “tie” of in-and-out bounds indicates an assurance of accuracy as the population of the state of Rhode Island doesn’t vary much from just under or just over 1 million people.
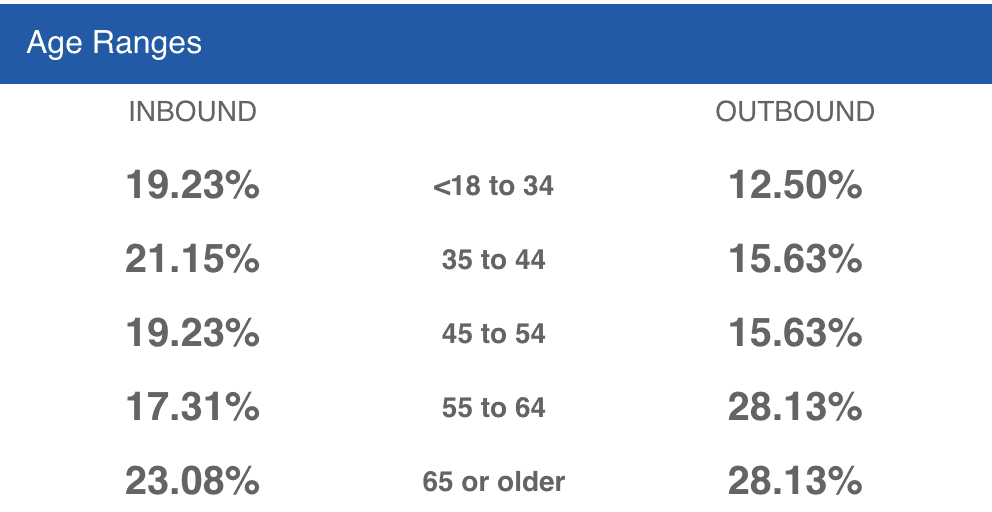
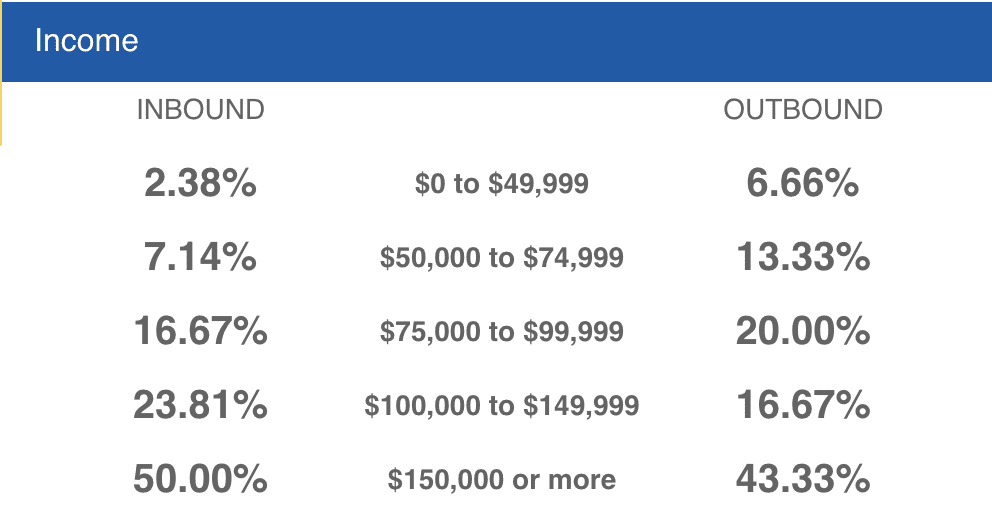
The demographics for coming IN to Rhode Island clearly show a younger group and a group with higher income. Here is what the data shows:

_____

_____

All 50 states report:
_____
Northeastern States Have Take Lead in Outbound Migration
Northeastern states make up four out of the seven states with the most outbound moves up to 2020. Prior to the pandemic, people were generally on the move out of New England. Some of the reasons given were:
1. Harsh winters, since temperatures and snow can be intense in the region.
2. Job availability is another factor since many companies are avoiding the region:
3. The Northeast is also home to many cities with a high cost of living, making housing
affordability challenging, especially as people lose their jobs.
After the pandemic time, Rhode Island should maximize on the new influx, modest though it may be, and remember the reasons we’ve been stagnant or loss population in the past. One factor not mentioned is the estate and inheritance tax. Housing should still make us competitive where you can move to Rhode Island and gave a comfortable home with a yard and in a community for under a half million dollars – versus – a condo in a high rise for three times that much. As the young’uns start raising families, the pull of quality of life will be a stronger motivator in choosing where to live – and the impact of remote work should work in Rhode Island’s behalf for years to come.
