Search Posts
Recent Posts
- Rhode Island Legislature Highlights Accomplishments for the 2025 Session June 25, 2025
- Sports in RI: Cody Tow, Volleyball Past, Present and Into His Future – John Cardullo June 25, 2025
- Need a Break? Time for Sour Grapes – Tim Jones June 25, 2025
- Rhode Island Weather Forecast for June 25, 2025 – Jack Donnelly June 25, 2025
- It is what it is: Commentary on 6.25.25 with Jen Brien June 25, 2025
Categories
Subscribe!
Thanks for subscribing! Please check your email for further instructions.

Leonard Lardaro measures RI’s economic climate
The Current Conditions Index, created by URI Professor of Economics Leonard Lardaro, measures the strength of the present economic climate in Rhode Island by following the behavior of 12 indicators pertaining to housing, retail sales, fiscal pressures, the employment situation, and labor supply:
- Government Employment
- Employment Services Jobs*
- Retail Sales
- University of Michigan US Consumer Sentiment Index**
- Single-Unit Housing Permits
- Private Service-Producing Employment***
- Manufacturing Man-hours****
- Average Hourly Manufacturing Wage
- Seasonally Adjusted Unemployment Rate
- Resident Labor Force
- New Initial Claims for Unemployment Insurance
- Unemployment Insurance Regular Benefit Exhaustions
Rhode Island’s overall Current Conditions Index (CCI) value returned to 25 in the month of November, returning to where it sat for the bulk of the summer after dipping to 17 during the month of October.
While this is a slight improvement, URI economist Leonard Lardaro notes this is far below where the economy stood in January and February of 2020.
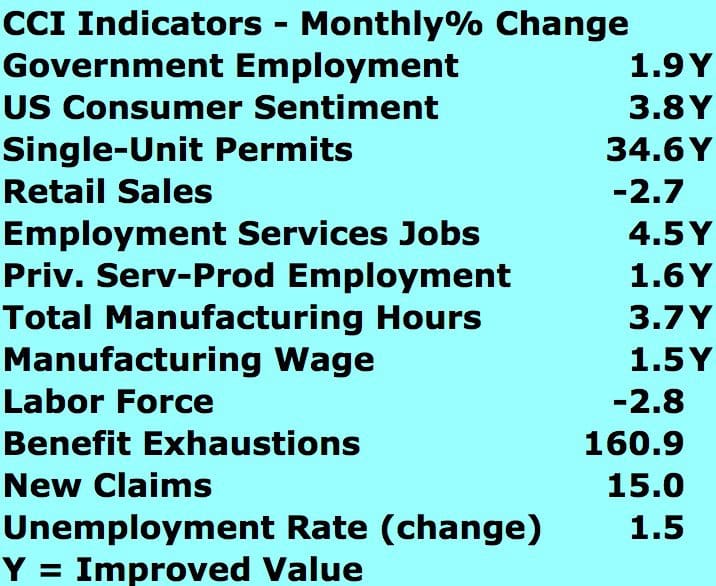
One bright spot, Single Use Permits, which is reflective of new home construction, were up for the first time since August. However, several indicators, including Total Manufacturing Hours, Employment Service Jobs, Unemployment and Benefits Exhaustion continued to move in the wrong direction.
Although Lardaro’s CCI is predicated on year-over-year changes, comparisons on a month-over-month basis had shown improvement in recent months. Unfortunately, the monthly value for November fell back to 42 after two months of improvement, leading Lardaro to put discussions of the possibility that the state may have been in the early stages of a recovery on hold.
More details:
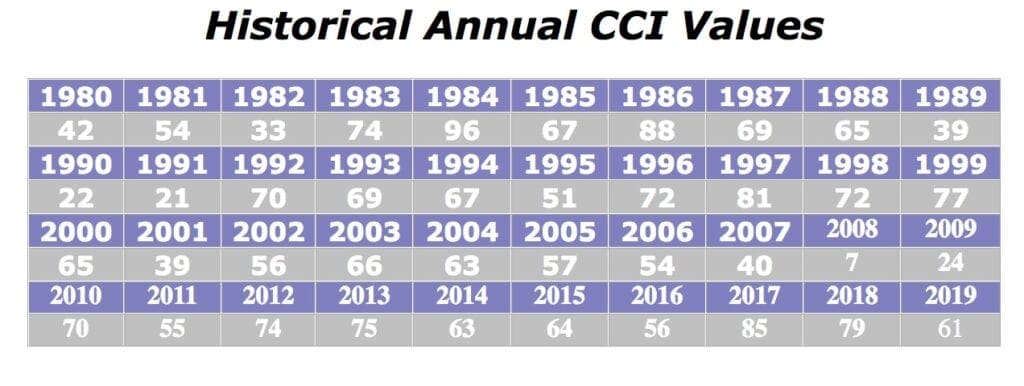
The CCI ranges from 0, when no indicators improve compared to year-earlier levels, to 100, when all twelve show improvement. Values above 50, the “neutral” value, indicate that the Rhode Island economy is expanding, while values below 50 are indicative of contraction.
Prior to “The Great Recession” that began in June of 2007, the CCI had never attained a value of 0, indicating that no indicators improved relative to year-earlier values. This changed in 2008, when the CCI fell to 0 on three occasions, and in 2009, when another value of 0 was recorded. Prior to this, the low for the CCI had been 8, which occurred for only a single month on several occasions. For almost all of 2008, the CCI recorded values of 8.
The CCI attained its maximum value of 100 on several occasions, for almost all of 1984 and once in 1986. Note that these values occurred exclusively when Rhode Island was still a manufacturing-based economy.


_____

Leonard Lardaro is Professor of Economics at the University of Rhode Island
