Search Posts
Recent Posts
- Johnston secures federal funds for all 9 home buyouts on Belfield Drive with persistent flooding April 23, 2024
- ART! Celebrating 13 years of Art Connection RI – at Shri Yoga April 23, 2024
- Rhode Island Weather for April 23, 2024 – John Donnelly April 23, 2024
- New Budlong Pool: Cranston DPW sets public meeting on ways to recognize its history April 23, 2024
- May 1st RI State House event launches Mental Health Month programs. Awards, personal stories. April 22, 2024
Categories
Subscribe!
Thanks for subscribing! Please check your email for further instructions.
Coronavirus Stats – what you should know about those apples and oranges…
Every day other than Saturday and Sunday, at approximately noon, the RI Dept. of Health downloads a data chart on testing, cases and deaths from the coronavirus in the state. We join the bevy of reporters who hover over their computers hitting “refresh-refresh-refresh” until the chart converts to the current day. Then it’s quick to a caption and a screen shot to see who will make it first posting today’s data on Facebook and Twitter.
It’s a rhythm we in the media have gotten used to – sometimes (we can tell) media outlets copy each other’s screenshots. We say ‘no problem’.
The media and others are now doing deeper dives into the data. Yesterday the RIDOH acknowledged that 9% of RI coronavirus deaths were actually deaths from another primary cause with coronavirus as an “associated” condition.
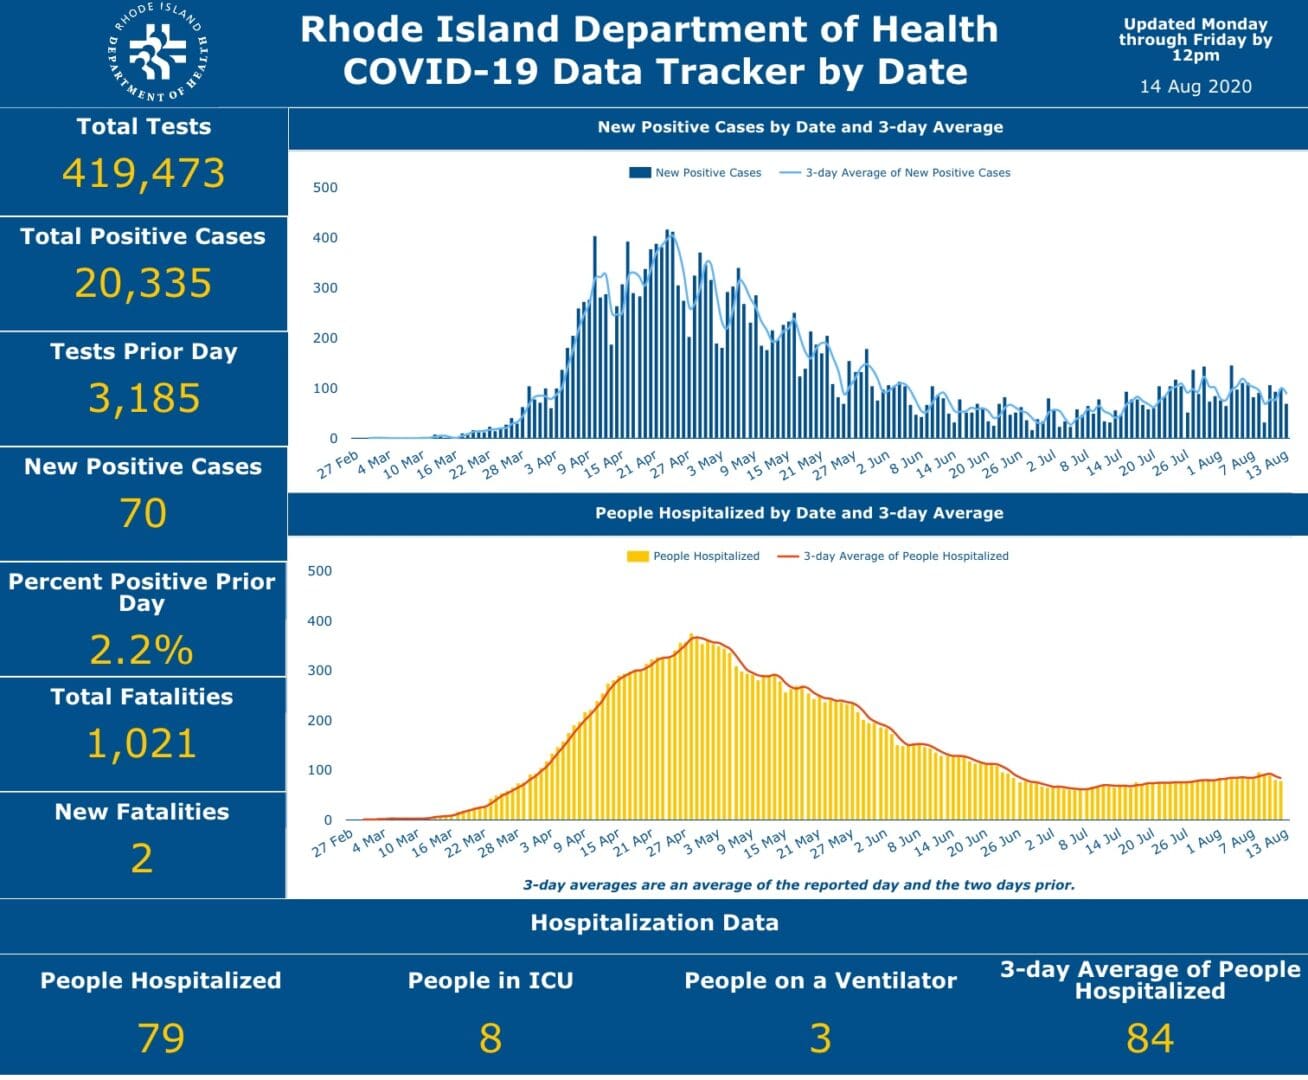
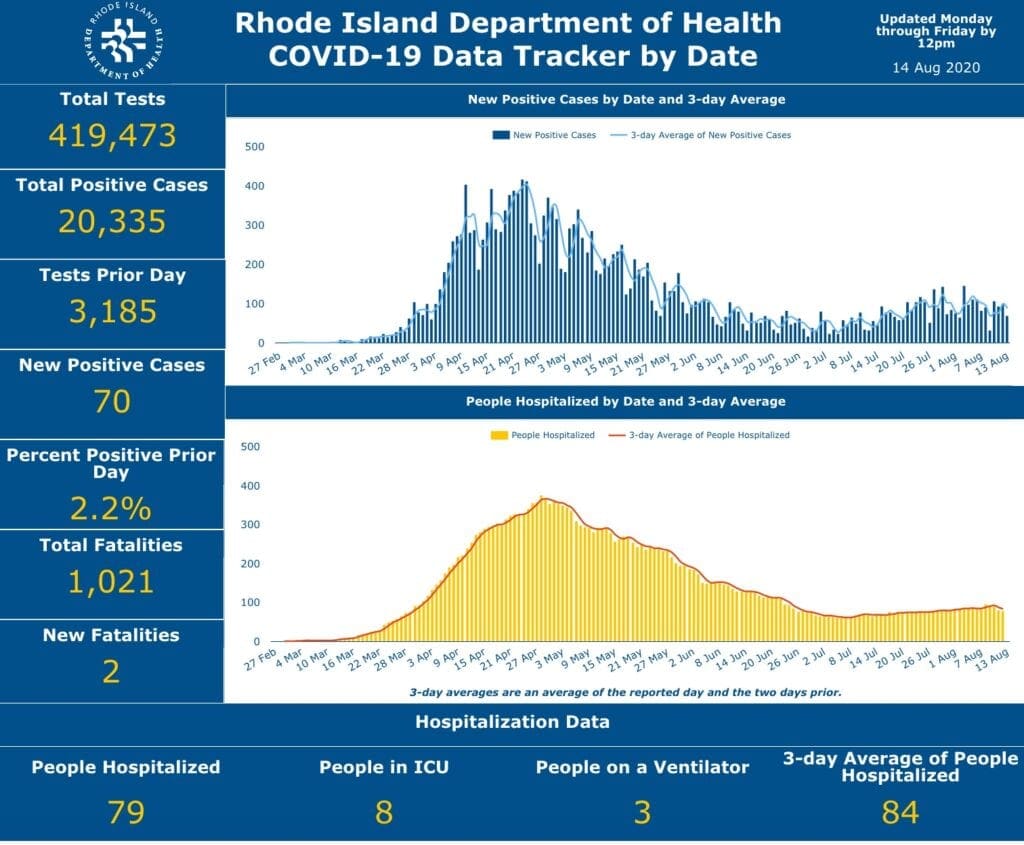
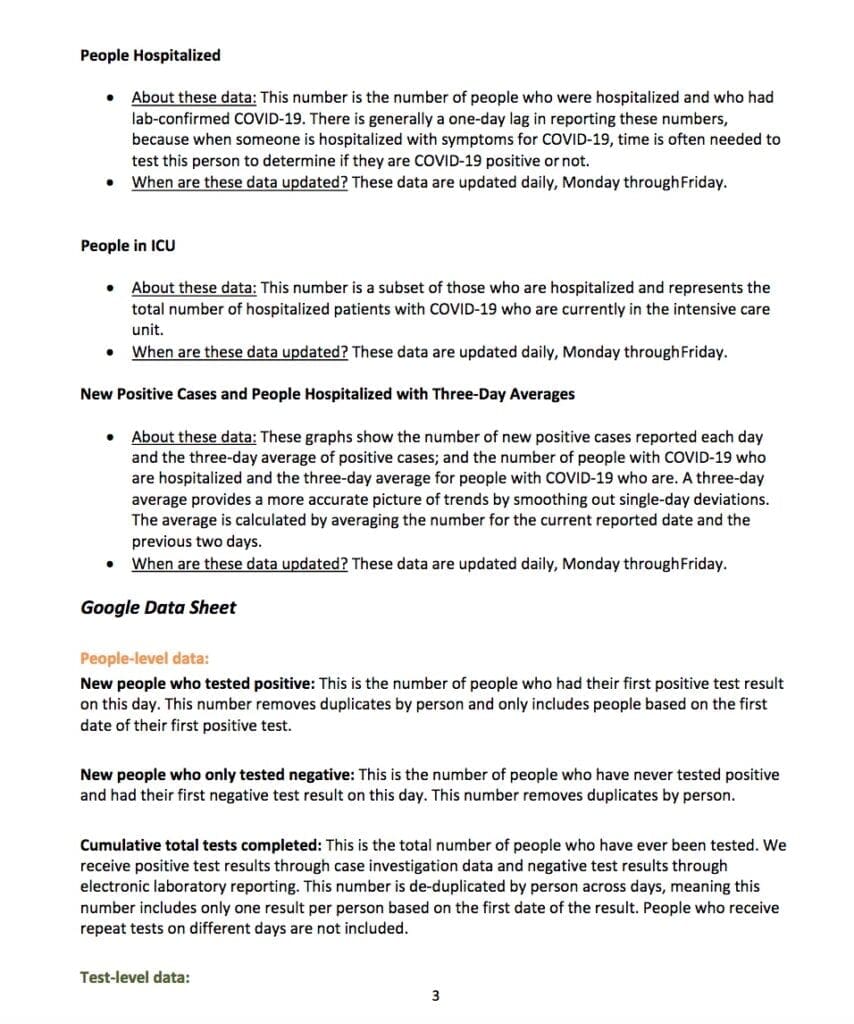
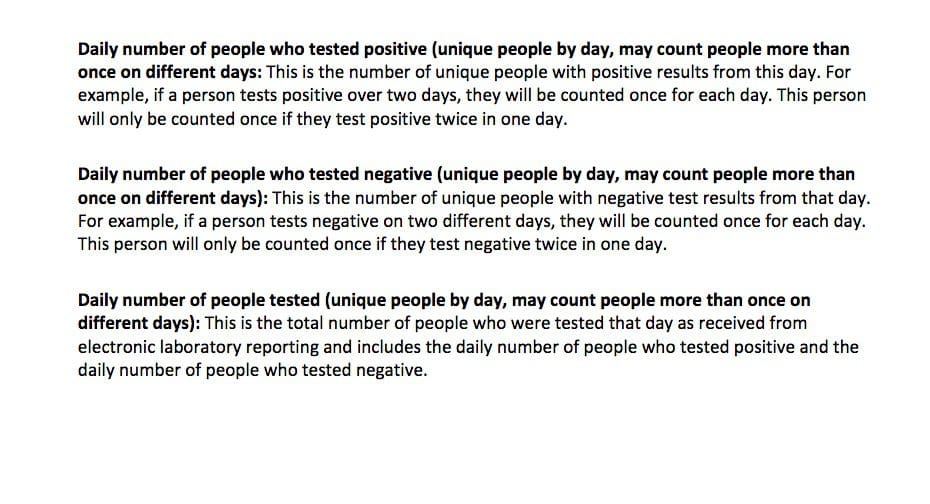
We get many questions about the data. To understand it better – including what data may have duplicative tests in it – and what doesn’t – and how to better interpret the data, please refer to the FAQs, which we are posting here. First, a Data Tracker chart (this one for Aug. 14th):
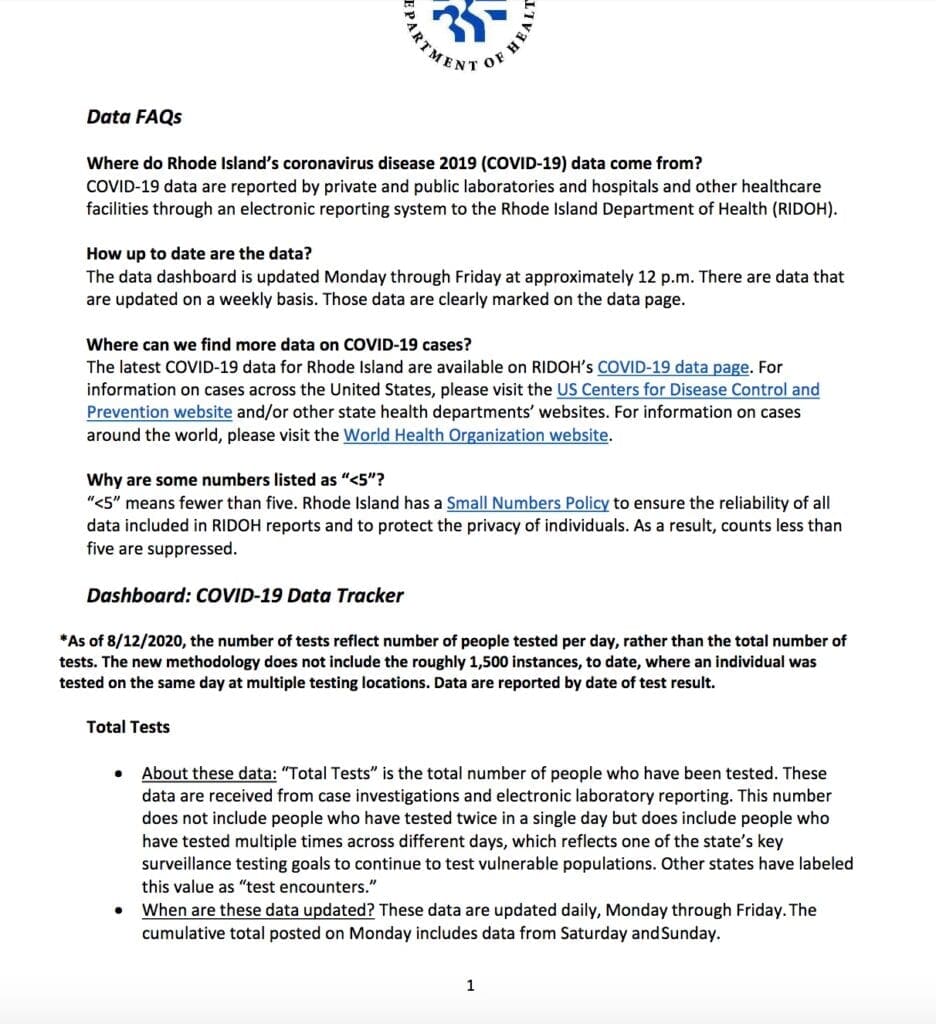
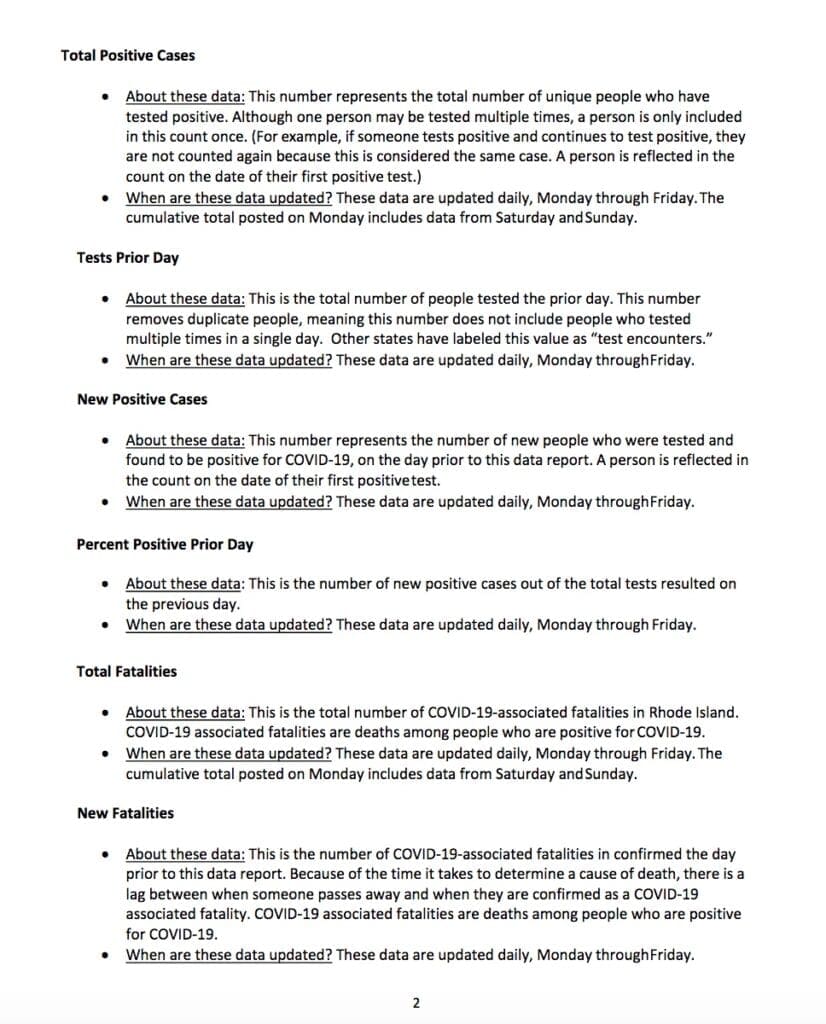
And, here is the memo from RIDOH which provides details about the data:
Keep in mind that each state has its own datasets, and comparing one state to the other may be like comparing apples and oranges. Without a standardized national reporting base, charts are being updated continuously to try to do this. With how fast coronavirus came upon us, it’s reasonable to see how standards were not immediately available. We expect data to be streamlined for accurate comparisons as time goes by.
To follow the RIDOH Data sets, go to: https://ri-department-of-health-covid-19-data-rihealth.hub.arcgis.com/
